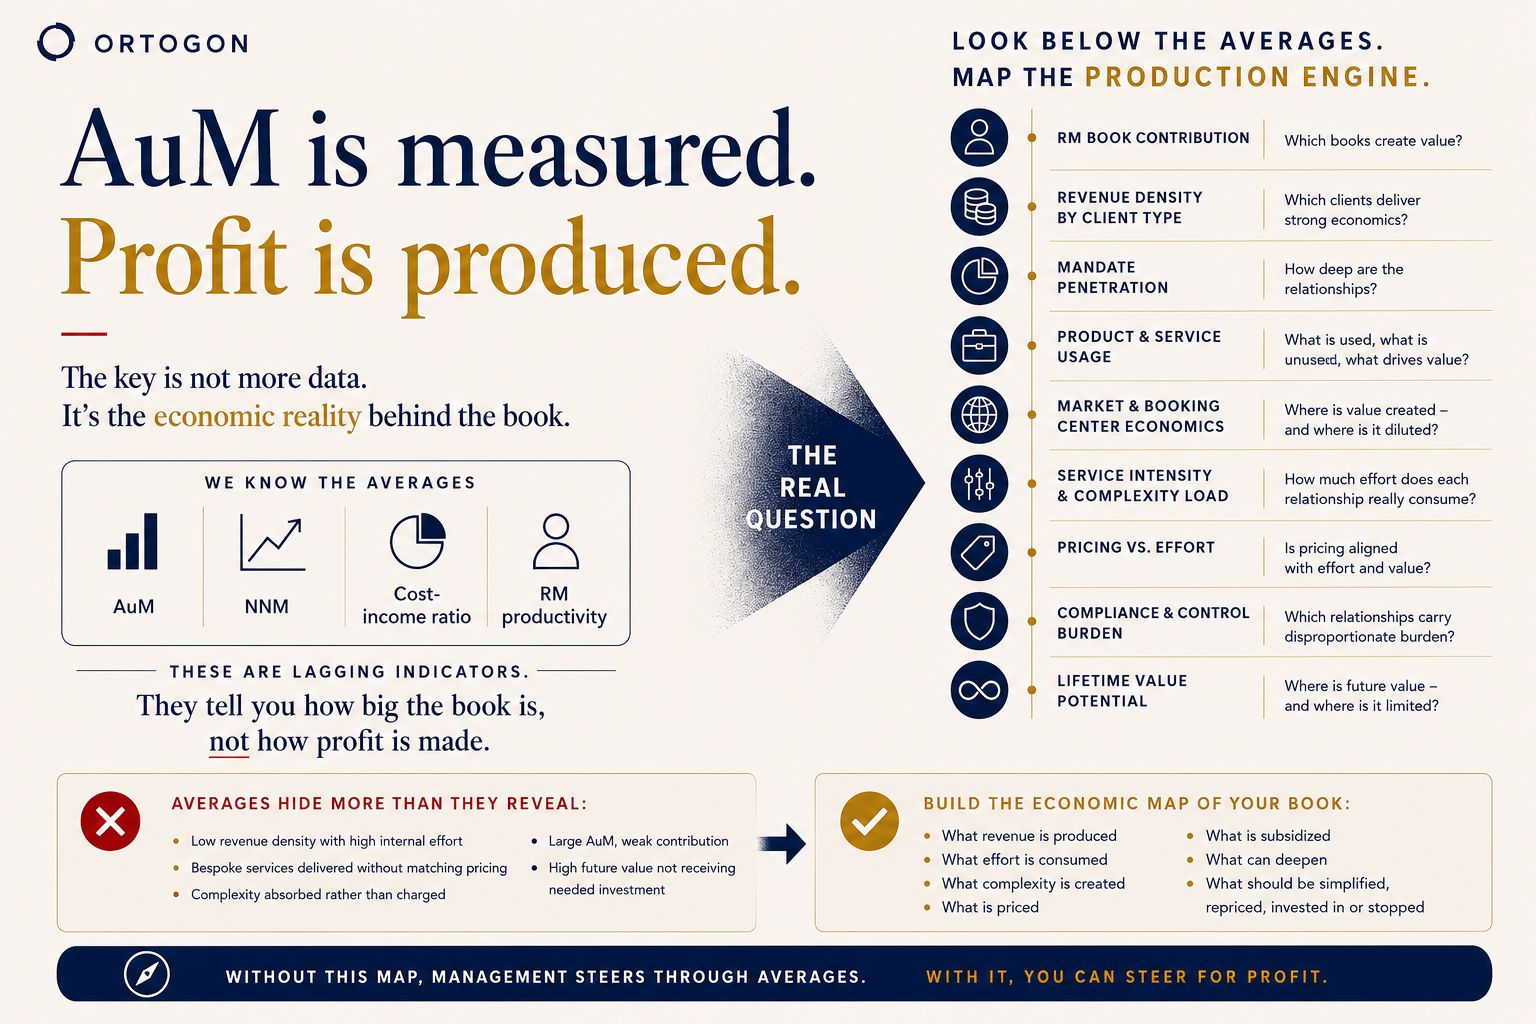
Most private banks already know their AuM, net new money, cost-income ratio and RM productivity. Fewer can explain with the same precision how profit is actually produced inside the client book.
Answering that question requires looking below formal segmentation and portfolio averages. The relevant economic map includes contribution by RM book, revenue density by client type, mandate penetration, product and service usage, market and booking-centre economics, service intensity, complexity load, pricing relative to effort, compliance burden and lifetime-value potential.
This is often where the picture becomes less comfortable. A bank may know its service model on paper without knowing how much time and specialist capacity each relationship actually consumes.
The invisible inputs include RM time, investment-specialist time, legal work, compliance reviews, operations support and senior-management attention. When these inputs are not measured at a meaningful level, cost-to-serve is allocated through averages.
Averages make the portfolio look cleaner than it is. They can hide clients with low revenue density and high internal effort, bespoke services delivered without corresponding pricing, complexity that is absorbed rather than charged and RM books that are large in AuM but weak in contribution.
The same averages can also hide relationships with high future value that deserve additional investment rather than cost reduction. The purpose of the analysis is not to classify every expensive relationship as unattractive, but to distinguish deliberate investment from invisible subsidy.
The first action is therefore not necessarily to cut costs, reprice every client or pursue more AuM. It is to reconstruct the economic map of the book: what produces revenue, what consumes effort, what creates complexity, what is priced, what is subsidized, what can deepen and what should be simplified, repriced, reinforced or stopped.
That is the practical meaning of mapping the production engine. It shows how assets become revenue, how revenue becomes contribution and where the conversion process fails.
Without that map, management is steering through averages—and averages are often where the real problem disappears.